Writing an argument or a persuasive paper? Need “the numbers” for
an item reported on the evening news? Numbers
and statistics are powerful pieces of evidence.
They are strong visuals that can strengthen an argument if they are from reliable sources and if
they are used correctly.
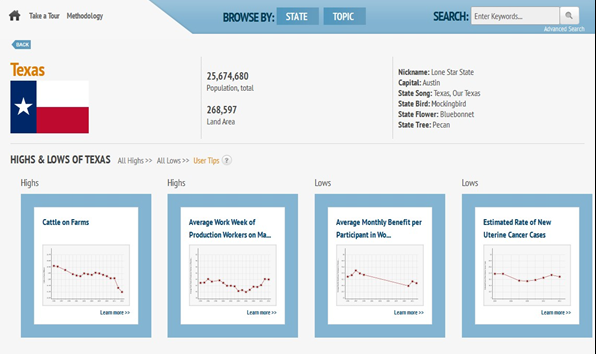
State
Stats is a database from CQ Press that provides comprehensive
data coverage of each state in several subject areas. You will find more than
15 years of data from more than 80 different sources.
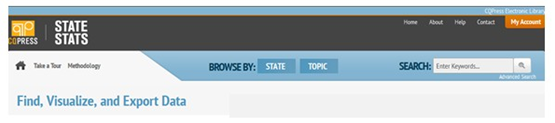
Search the
library catalog for State Stats, then click on the resource link
to open the database. If searching off campus, you will need to enter your ACCeID and password to get to the database.
Information in State Stats has been published in print volumes, such as State Rankings books, or taken from private or government online sources, such as U.S. Census Bureau databases like American FactFinder.
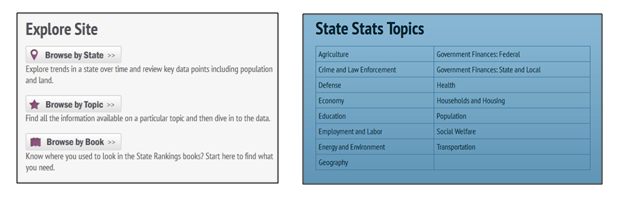
Like most databases, State Stats offers both general and advanced search features. You can also browse by state, by topic, or by State Rankings books. Browsing by topic is a useful way to explore the database. You can refine your results after searching or browsing.
Information will first be
presented as a map. Each state will
be shaded according to its rank for whatever topic you have chosen.
While there is no key to indicate what various the shades mean, you can
mouse over each state to view a pop-up description. A time line at the
bottom of the image lets you zoom through multiple years of statistics.
Press the "Play" button to animate your data. Many graphics can be
animated to show changes over a period of time from 1995 to 2010 or
later.
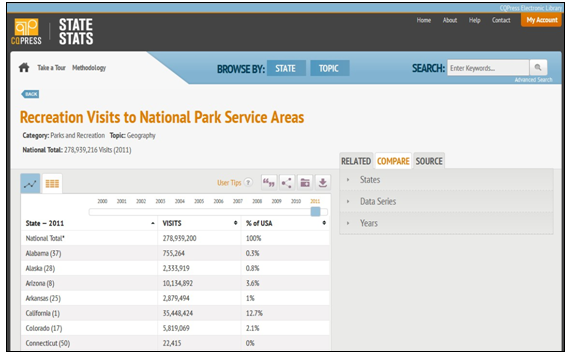
Comparing data
When you find data that interests you, explore it! Use the power of the database to compare multiple sets, add multiple states, data series, and years, and use the mapping and graphing tools. You can create a trend line chart of up to 6 states for any data series. Compare any two data series to see if there is a correlation. On the Compare tab, choose Data Series and then use the drop down list to select the data series you would like to compare to the one you are viewing.
When you find data that interests you, explore it! Use the power of the database to compare multiple sets, add multiple states, data series, and years, and use the mapping and graphing tools. You can create a trend line chart of up to 6 states for any data series. Compare any two data series to see if there is a correlation. On the Compare tab, choose Data Series and then use the drop down list to select the data series you would like to compare to the one you are viewing.
Creating Output
You can display results as a map (state view), table, scatter plot, or line chart. View any data series as a table by selecting the second tab just below the data series title. You can scroll through all available years on the table view page and sort data alphabetically or numerically.
Download your data to use it in reports
To export data, go to the data series page and choose the export option above the panel. All results can be shared by e-mail or hyperlink, saved, or exported as PNG, JPEG, CSV, or Excel files. Exported data files in Excel format will include the date of download, descriptions of the data, and, most importantly, original source information.
Maps and graphs can be downloaded as PNG files, which will look exactly like the screen image.
Citing
State
Stats features CQ Press’s CiteNow!® function for generating
source citations in APA, MLA, Chicago (Turabian), and other styles.
Take a tour
View the video tour of State Stats to see its features in
use.

No comments:
Post a Comment
Note: Only a member of this blog may post a comment.